
Navigate the dashboard
The dashboard is QueryGuard's home screen — every workspace in your organization with its headline numbers, plus your uploaded keyword files.
Overview
The page has two parts. The sidebar on the left stays with you everywhere in the app: it holds the org switcher, the main navigation, your plan badge, and the account menu. The main area lists your workspaces, one card each, followed by the Keyword Files section. Create Workspace at the top right adds a new one.
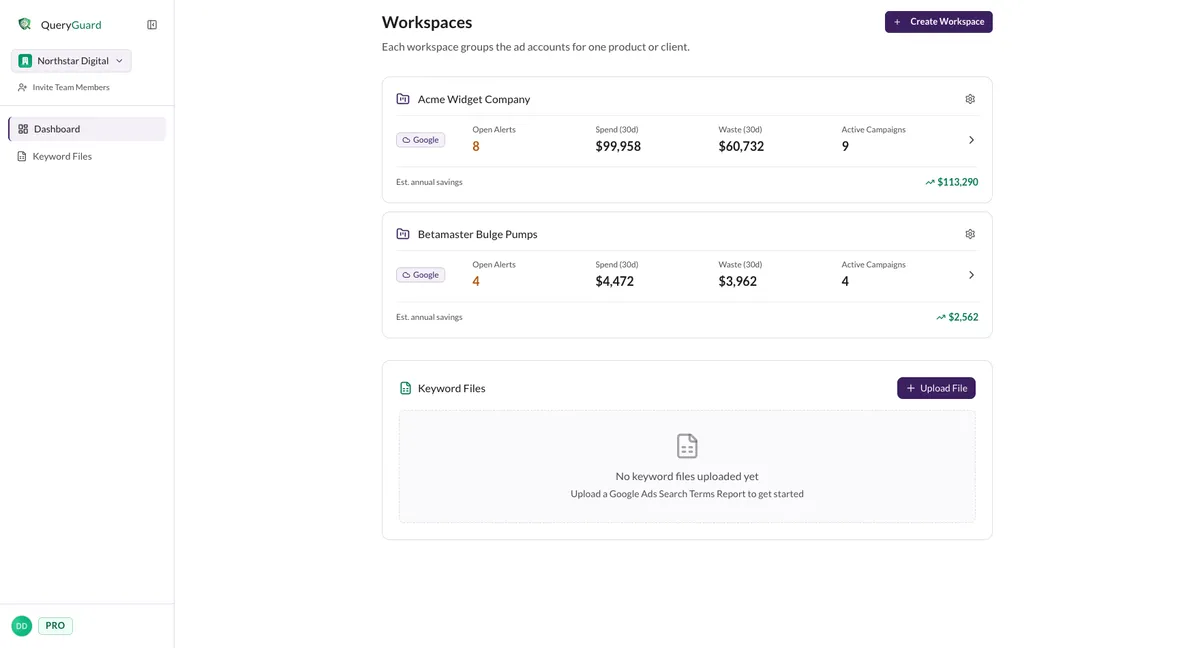
Each workspace card shows the four numbers that matter for its connected account:
| Stat | What it is | Clicking it |
|---|---|---|
| Open Alerts | Search terms waiting for a decision | Opens the account's Alerts tab |
| Spend (30d) | Search-term spend over the last 30 days | — |
| Waste (30d) | Spend with zero conversions over the last 30 days | Opens the Waste Report tab |
| Active Campaigns | Campaigns that spent in the last 30 days | — |
Clicking anywhere else on the card opens the account itself. The footer tracks Est. annual savings — the projected yearly saving from the negative keywords you've applied through QueryGuard, across all the workspace's sources.
Direct link: Dashboard
Quick Tips
- Open Alerts is the triage number: it turns orange as soon as anything needs a decision, so a quick scan of the cards tells you where to start.
- Spend (30d) and Waste (30d) are rolling 30-day windows, so they drift day to day. Est. annual savings is all-time — see Estimated annual savings for how it's worked out.
- Invite Team Members only appears for org admins.
- On the Starter plan, the Keyword Files section shows how many of your file slots you've used; at the cap, Upload File becomes Upgrade to Add More.
- If a card shows Reconnect instead of a chevron, that account's connection has expired — reconnect it to resume the nightly sync. See Sync status and reconnecting.
Steps
1. Open an account from its workspace card
Click anywhere on a card — or the chevron at the right — to open that account's view. The stats double as shortcuts: Open Alerts lands on the Alerts tab and Waste (30d) on the Waste Report, so you can jump straight to what you came to check.
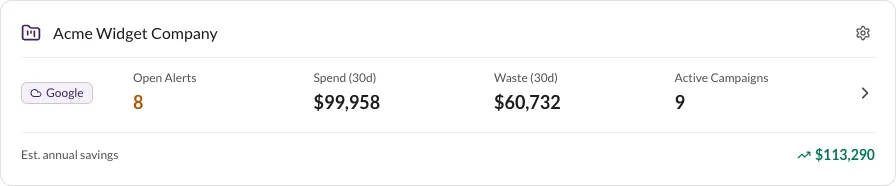
The gear icon at the card's top right opens workspace settings instead — that's where alert thresholds, team access, and connected accounts live. See Create and manage workspaces.
2. Work with keyword files
The Keyword Files section lists your uploaded Search Terms report CSVs — the five most recent, with a View all N files link when there are more. Each card shows the file's reporting period, term count, and total spend; click it to open its analysis.
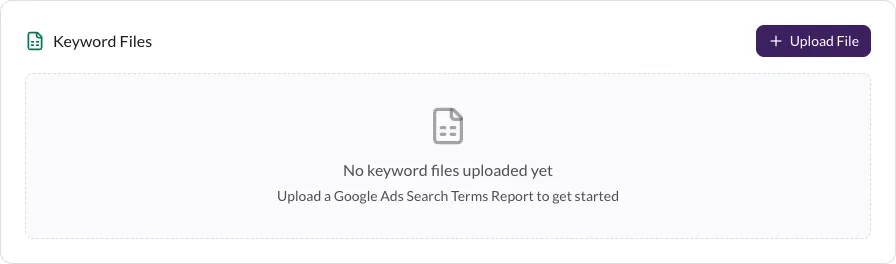
Upload File opens the upload dialog — Keyword files (CSV upload) walks through the whole flow. To remove a file, open the ⋮ menu on its card and choose Delete File.
3. Get around with the sidebar
The sidebar has two nav items: Dashboard brings you back here, and Keyword Files opens the full file list — it stays highlighted while you're inside a file's analysis too. On smaller screens the sidebar becomes a menu button in the top bar that opens the same content.
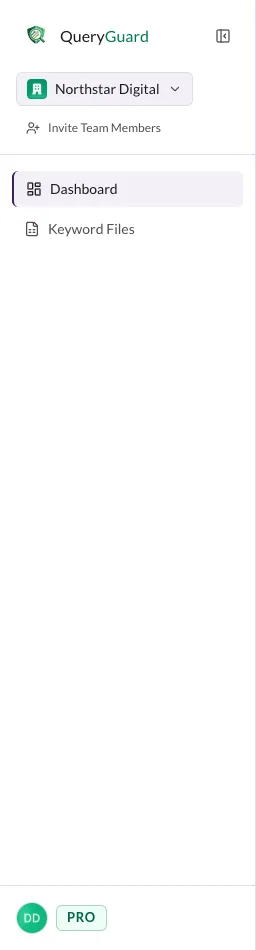
The icon button beside the logo collapses the sidebar to icons; hover an icon to see its label. Collapsing hides the org switcher, invite button, and plan badge — the nav and your account menu stay. Use the expand button to bring it back.

4. Switch organizations or invite your team
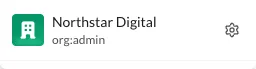
The button at the top of the sidebar shows your current organization. Open it to see the org and your role; the gear opens the organization's settings. If you belong to more than one organization, they're listed in the menu — picking one switches the dashboard to that org.
Invite Team Members, just under the switcher, opens the member list where you can invite teammates by email — see Invite your team. It's only visible to org admins.
5. Check your plan and open the account menu
The bottom of the sidebar holds two things: a pill showing your organization's plan, and your avatar, which opens the Account menu — see Account menu and settings.
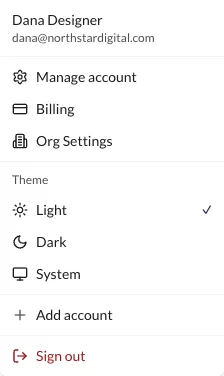
From there: Manage account for your profile and sign-in settings, Billing for the subscription, Org Settings for org-wide integrations, the Theme switcher (Light, Dark, or System), Add account to sign in with a second login, and Sign out.