
The account view
Every connected Google Ads account gets its own account view — one page that gathers the account's alerts, waste analysis, search-term data and applied negatives under a single header.
Overview
You reach the account view from a workspace card on the dashboard. The page is organized in three layers:
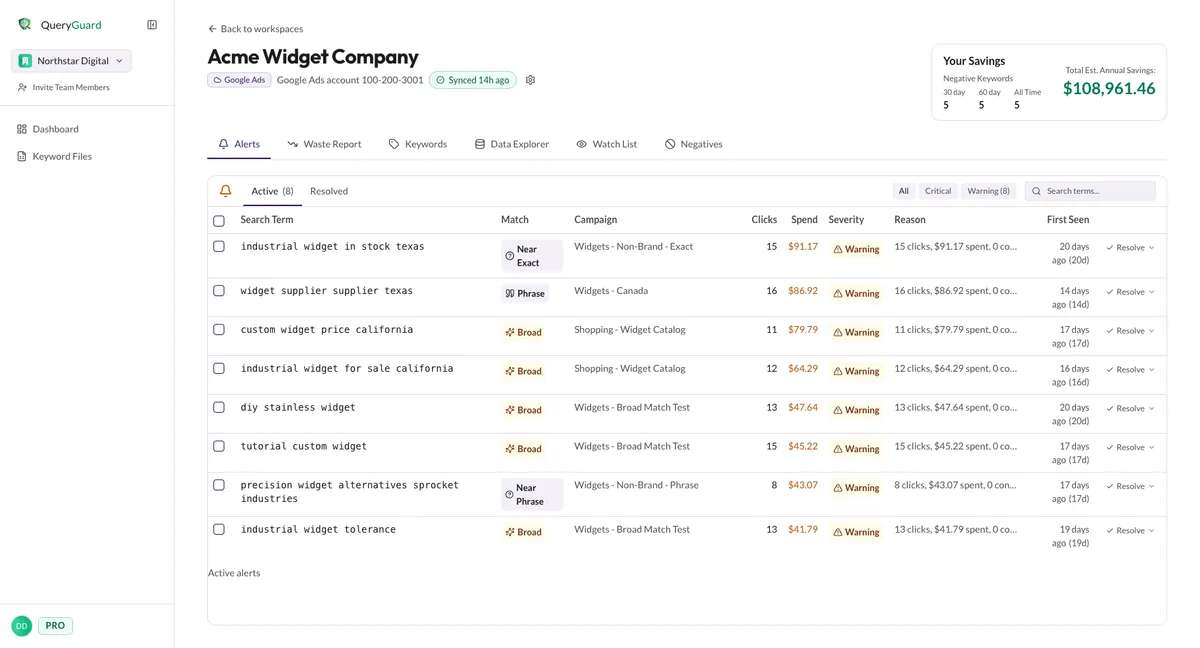
- The header identifies the account — its name, platform badge and customer ID — shows when data last synced, and links to the workspace settings.
- Your Savings tracks what the negatives you've applied are projected to save over the next year.
- Six tabs hold the actual work, from the alert queue through to the applied negatives.
| Tab | What it's for |
|---|---|
| Alerts | The triage queue: search terms flagged as wasteful, each with a Resolve action. The default tab. |
| Waste Report | Flagged spend grouped into patterns — zero-conversion terms, freebie seekers, broad-match bleeders and more — with the spend behind each. |
| Keywords | Which of your keywords triggered the wasteful terms, ranked by wasted spend. |
| Data Explorer | The full search-term table: sortable and filterable, with bulk exclude and watch actions. |
| Watch List | Terms you or your teammates are keeping an eye on, with cost trends. |
| Negatives | The negative keywords QueryGuard has written to the account — change a match type or remove one here. |
Direct link: Dashboard
Quick Tips
- The page always opens on Alerts — work the queue first, then use the Waste Report for the bigger picture behind it.
- The date range applies to Waste Report, Keywords and Data Explorer only. Alerts, Watch List and Negatives keep their own views — the watch list has its own 30d/60d/90d/All toggle.
- Presets end at your newest synced day, not today's date. Data arrives each night, so Last 30d always means the last 30 days of data.
- The Your Savings total counts up the moment a new exclusion lands — that animation is your confirmation the negative was written.
- The URL always reflects the view — copy it to send a teammate to the same tab, range and filters.
Steps
1. Open the account view
From the dashboard, open a workspace card — the account name is the link. You land on the Alerts tab.
2. Read the header and Your Savings
The header tells you which account you're looking at and how fresh the data is:
- Back to workspaces returns to the dashboard.
- The Google Ads badge and the hyphenated customer ID identify the account.
- The sync pill reports the last completed sync — "Synced 15h ago" means everything below is current as of the most recent nightly run. See Sync status and reconnecting if it shows a failure.
- The gear opens Workspace settings — alert thresholds, delivery channels and team access. See Create and manage workspaces.
The Your Savings card sits at the top right. Negative Keywords counts how many negatives were applied over the last 30 days, 60 days, and all time; Total Est. Annual Savings is the projected yearly saving behind them. See Estimated annual savings for how the projection works.

3. Set the date range
On Waste Report, Keywords and Data Explorer, a date row sits between the tabs and the content:
- Last 7d, Last 14d, Last 30d and Last 60d presets — the active one is highlighted. They end at the newest synced day; if a preset reaches further back than your data goes, the start clamps to the first synced date.
- The Start date and End date inputs set a custom window — they can't go outside your synced data.
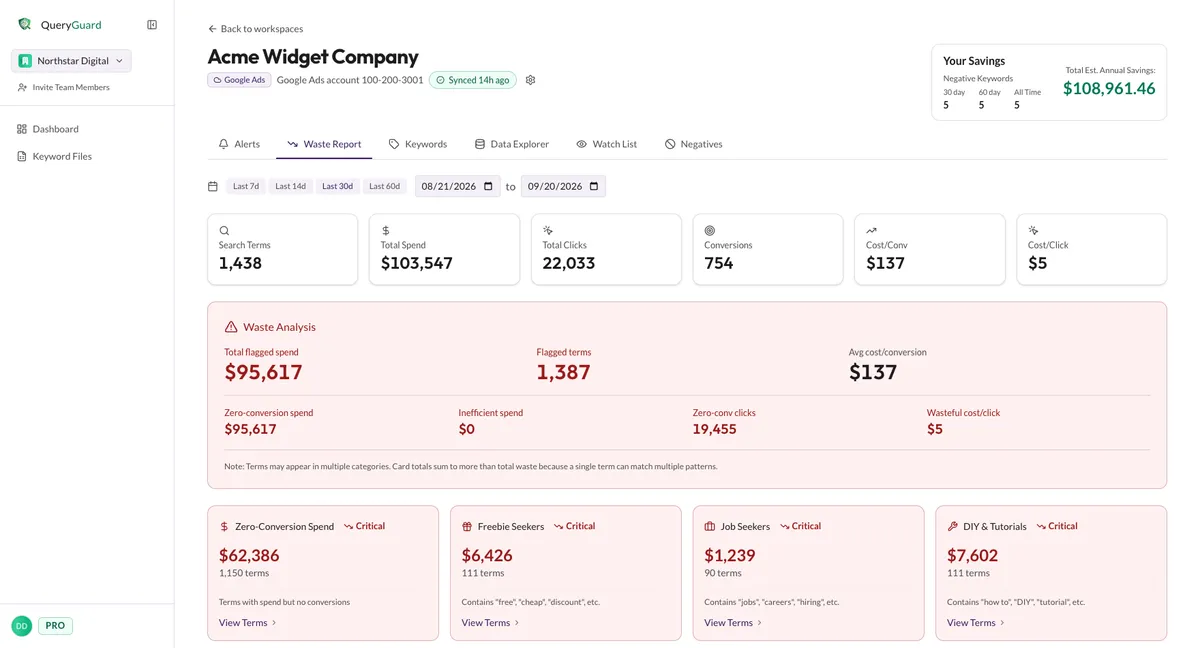
Six stat cards summarize the window you've picked: Search Terms, Total Spend, Total Clicks, Conversions, Cost/Conv and Cost/Click. Everything below them — waste categories, keyword rollups, the explorer table — recalculates over the same range.
4. Share the exact view
The URL always reflects what you're looking at: ?tab= selects the tab, startDate and endDate carry the range, and the Data Explorer adds every filter, sort and page. Copy the address bar to bookmark a view or send it to a teammate — they'll need workspace access to open it.